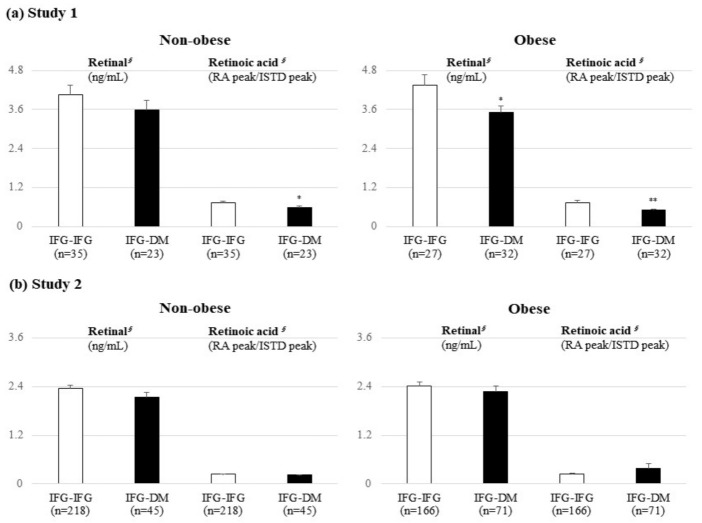
Figure 2.
Results of the targeted UHPLC/MS analysis on retinal and retinoic acids between the IFG-IFG and IFG-DM groups stratified by BMI. Mean ± standard error (SE). § tested following a logarithmic transformation. p-values were derived from an independent t-test; comparison of the baseline levels of retinal and retinoic acids between the IFG-IFG group (IFG at baseline and follow-up) and the IFG-DM group (IFG at baseline but DM developed after the 7-year mean follow-up period). * p < 0.05, ** p < 0.01, and *** p < 0.001 were the results of the within-group comparisons of each group. DM: diabetes mellitus, IFG: impaired fasting glucose, ISTD: internal standard, RA: retinoic acid.

