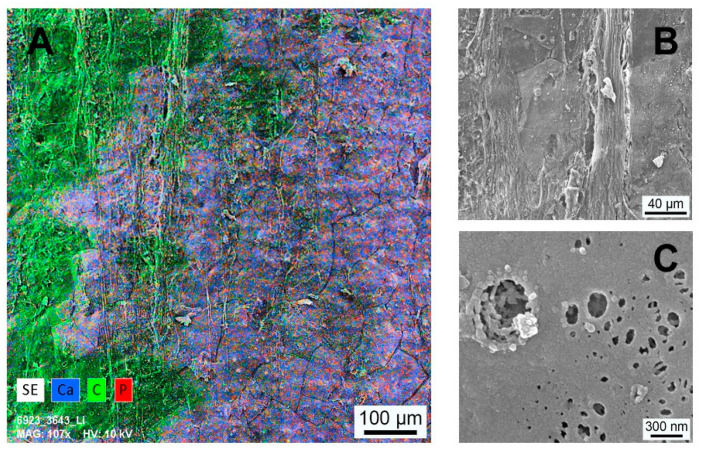
Figure 8.
(A) EDX mapping of the implant surface (SPI) 8 weeks postoperative. The positions of the elements calcium, carbon and phosphor are indicated in blue, green and red, respectively. Areas covered with soft tissue are correlated with carbon. The residual surface shows higher concentration of calcium and phosphor. (B) Higher magnification of a surface portion with fibrous soft tissue coverage. (C) Smooth extracellular matrix covering areas with Ca and P occurrence—irregularities in this matrix exhibit an underlying nanostructure.

