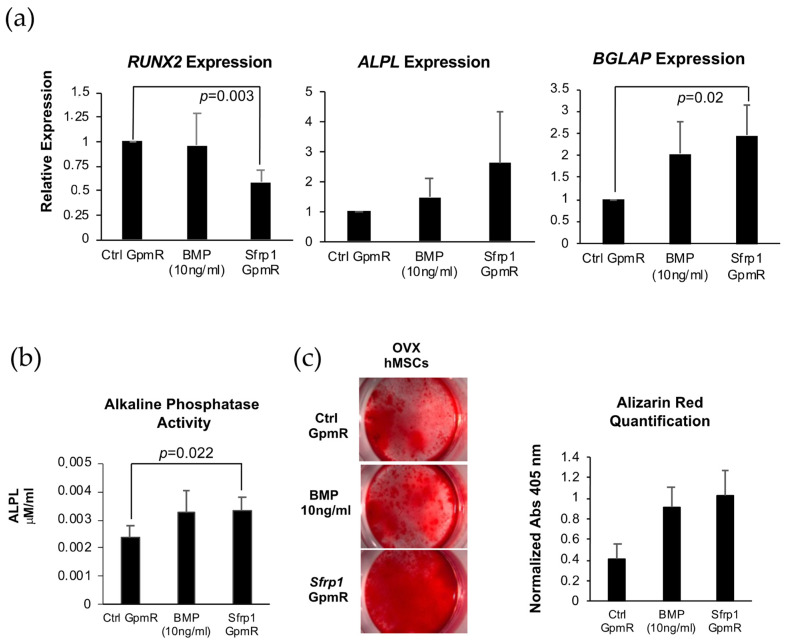
Figure 5.
Effect of SFRP1 silencing on the osteogenic potential of human MSCs from osteoporotic patients. All analyses were performed at 21 days of osteogenic differentiation. (a) Semi-quantitative PCRs showing the relative expression levels of different osteogenic markers (RUNXx2, ALPL, and BGLAP) in hMSCs from osteoporotic patients (MSC-OP) transfected with a control GapmeR (Ctrl) and a GapmeR for the silencing of SFRP1 expression. The expression of the analyzed markers in the presence of 10 ng/mL of BMP-2 was used as a reference of the effectiveness of SFRP1 silencing. Values reflect averages of five different samples (n = 5). Technical triplicates were also performed with each individual sample. (b) Graph showing the ALPL activity in MSC-OP under the different experimental conditions analyzed. Graph shows average values of five independent samples. (c) Osteogenic differentiation of the same hMSCs-OP transfected with the SFRP1 GapmeR or differentiated in the presence of 10 ng/mL BMP-2 as revealed by Alizarin Red staining. Results from one representative sample are shown in the pictures. Bar graph represents quantification of the staining. In all graphs, bars represent standard error of the mean values. p-values are indicated.

