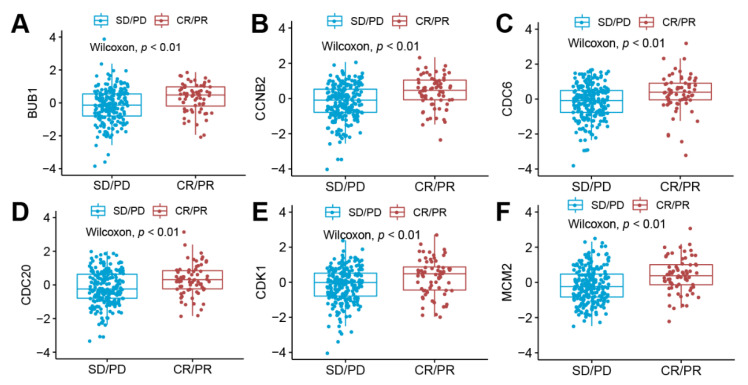
Figure 4.
The correlation between the mRNA expression levels of hub proteins with the drug response to immunotherapy (atezolizumab/anti-PD-L1) in the validation data set (Imvigor210). (A) The box plot revealed that high BUB1 expression was associated with the better response to immunotherapy (p < 0.05). (B) The box plot revealed that high CCNB2 expression was associated with the better response to immunotherapy (p < 0.05). (C) The box plot revealed that high CDC6 expression was associated with the better response to immunotherapy (p < 0.05). (D) The box plot revealed that high CDC20 expression was associated with the better response to immunotherapy (p < 0.05). (E) The box plot revealed that high CDK1 expression was associated with the better response to immunotherapy (p < 0.05). (F) The box plot revealed that high MCM2 expression was associated with the better response to immunotherapy (p < 0.05). Abbreviation: CR, complete response; PR, partial response; SD, stable disease; PD, progressive disease.

