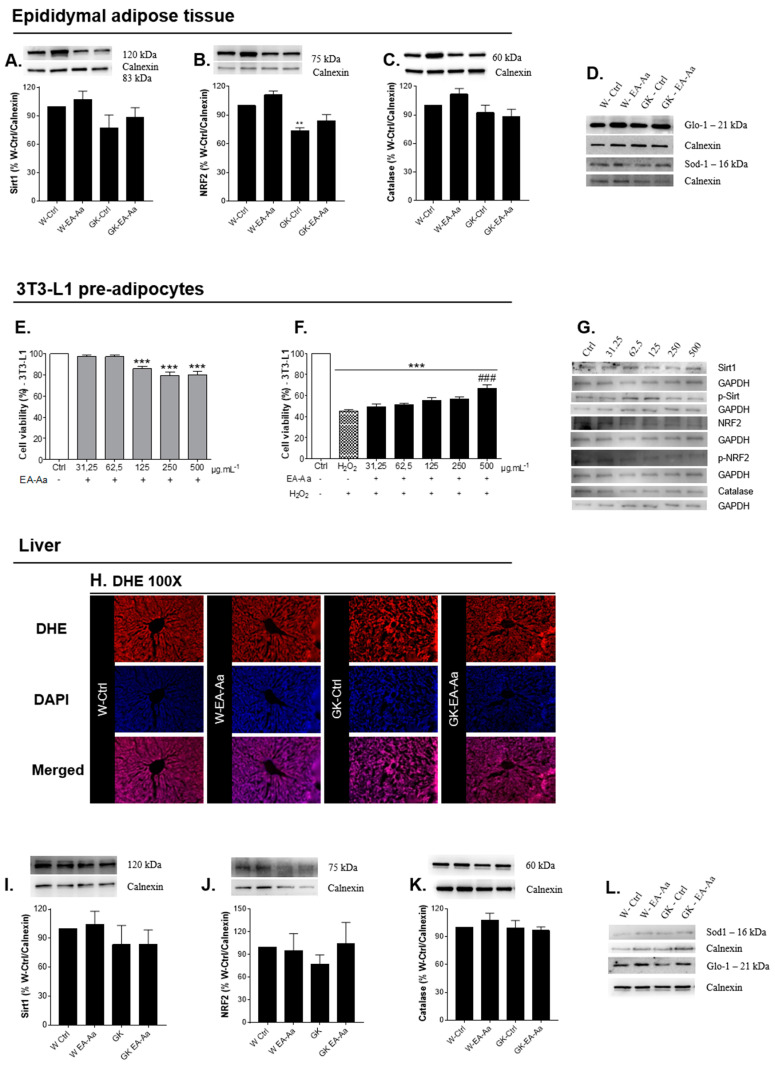
Figure 3.
Antioxidant effects of EA-Aa in EAT, liver and in 3T3-L1 pre-adipocytes (n = 3 independent experiments). (A) Sirt1 levels in EAT. (B) NRF2 levels in EAT, EA-Aa promotes partial restoration of NRF2 levels in the non-obese type 2 diabetic EA-Aa-treated group. (C) Catalase levels in EAT. (D) Representative images of EAT Western blot. Cell viability of pre-adipocytes 3T3-L1: (E) Treatment with EA-Aa for 24 h. (F) Treatment with EA-Aa (previously for 30 min) and induction to oxidative stress with H2O2 (for 2 h). (G) Representative images of 3T3-L1 Western blot. (H) Dihydroethidium (DHE) staining in liver (n = 3). (I) Sirt1 levels in liver. (J) NRF2 levels in liver. (K) Catalase levels in liver (n = 5 for Western blots). (L) Representative images of liver Western blot. * vs. W-Ctrl/Ctrl; # vs. H2O2; ** p < 0.01; ***,### p < 0.001.

