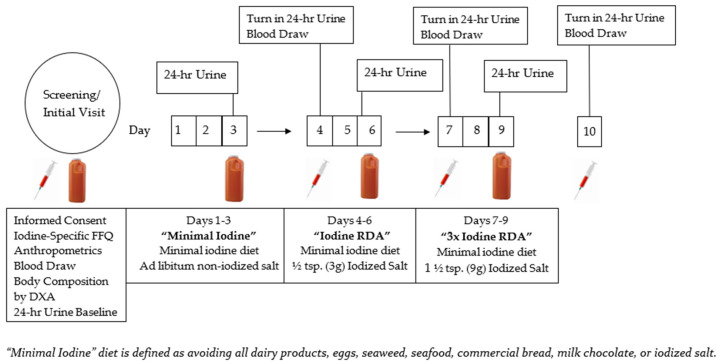
Figure 1.
Protocol schematic showing the iodine titration diet progression at the initial visit and ending on day 10. The “syringe” graphic indicates scheduled blood draws and “orange urine collection jugs” indicate 24 h urine collections time points. A minimal iodine diet is defined at the bottom of the schematic.

