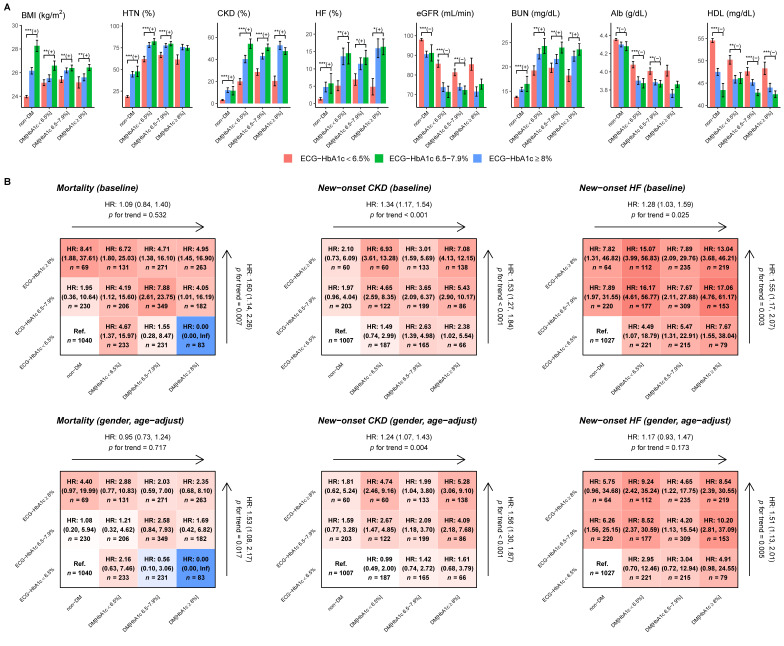
Figure 5.
Characteristics and risk analysis in patients with actual HbA1c and ECG-HbA1c. (A) Patient characteristics in different ECG-HbA1c groups and real HbA1c groups. Bars represent the mean or proportion where appropriate and corresponding 95% conference intervals, which are adjusted by real HbA1c in each group via linear or logistic regression. Significant tests are based on the trend test (*: p for trend < 0.05; **: p for trend <0.01; ***: p for trend <0.001), and the sign represents the correlation direction. (B) Risk matrixes of ECG-HbA1c and HbA1c groups on DM related complications. The hazard ratios (HRs) are based on a Cox proportional hazard model before and after adjusting by gender and age. The color gradient represents the risk of corresponding group.

