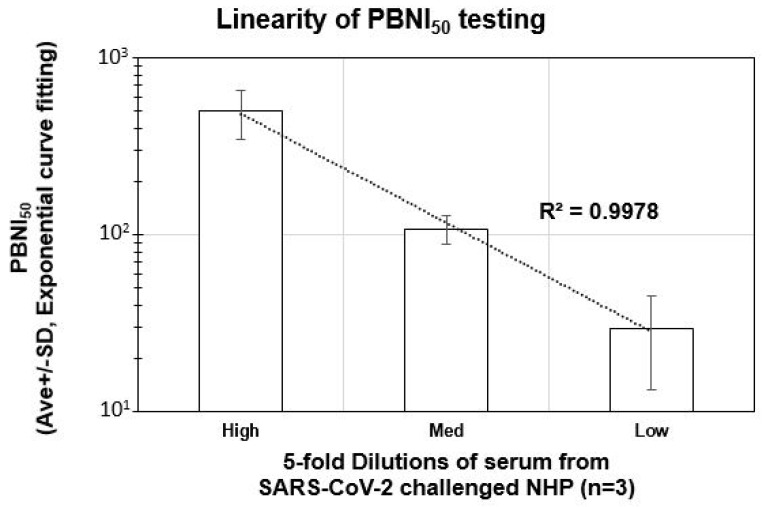
Figure 4.
Linearity of PBNI50 testing: three (3) serum samples from SARS-CoV-2-challenged NHPs (1M16756, 3M16763, 3F16765) with a high PBNI50 were serially diluted 5-fold to generate test samples with a high, medium, and low PBNI50, followed by a PBNA with 6-point dilution in triplicate at each dilution. The average ± SD of the three PBNI50 for high, medium and low test samples are shown on the Y-axis. The X-axis denotes the test samples with high, medium, and low PBNI50. Trend analysis between the three groups is shown by the dotted line (R2 = 0.9978).

