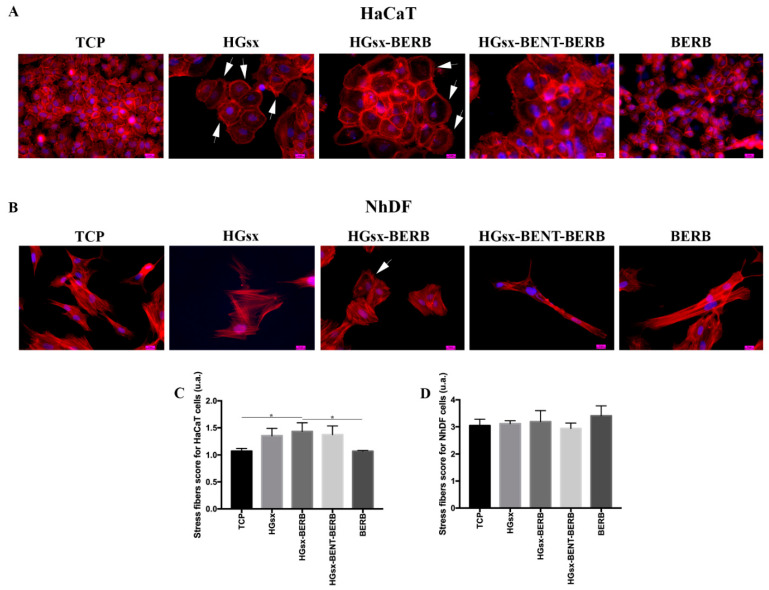
Figure 5.
Morphological and stress fibers evaluations. Representative images of actin cytoskeleton immunofluorescence detection in HaCaT (A) and NhDF (B) cultured in the different conditions. 40× magnification. Scale bar 10 µm. White arrows indicate migration features in cells: lamellipodia and filopodia in HaCaT cells (A) and actin polarization at the cellular front in NhDF cells (B). (C) Stress fibers score for HaCaT cells: significant differences between TCP and HGsx-BERB, and HGsx-BERB and BERB were found. (* p ≤ 0.05) (D) Stress fibers score for NhDF cells.

