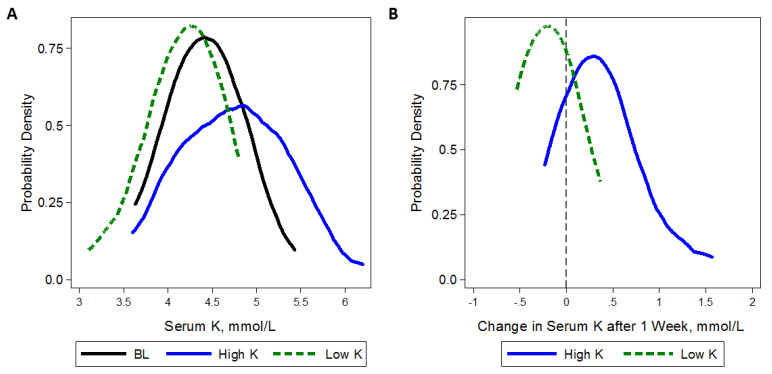
Figure 3.
Kernel density plots of (A) serum potassium (K) levels (mmol/L) at baseline (BL) and after 1 week of higher (100 mmol/day, solid line) or lower (40 mmol/day, dash line) K intake; and (B) change in serum K levels after 1 week of higher (solid line) or lower (dash line) K intake. Baseline kernel density represents 3 measurements of serum K obtained after the Run-In visit, prior to starting the higher-K diet, and prior to starting the lower-K diet. In (B) gray vertical line represents a change of 0 mmol/L.

