Figure 5.
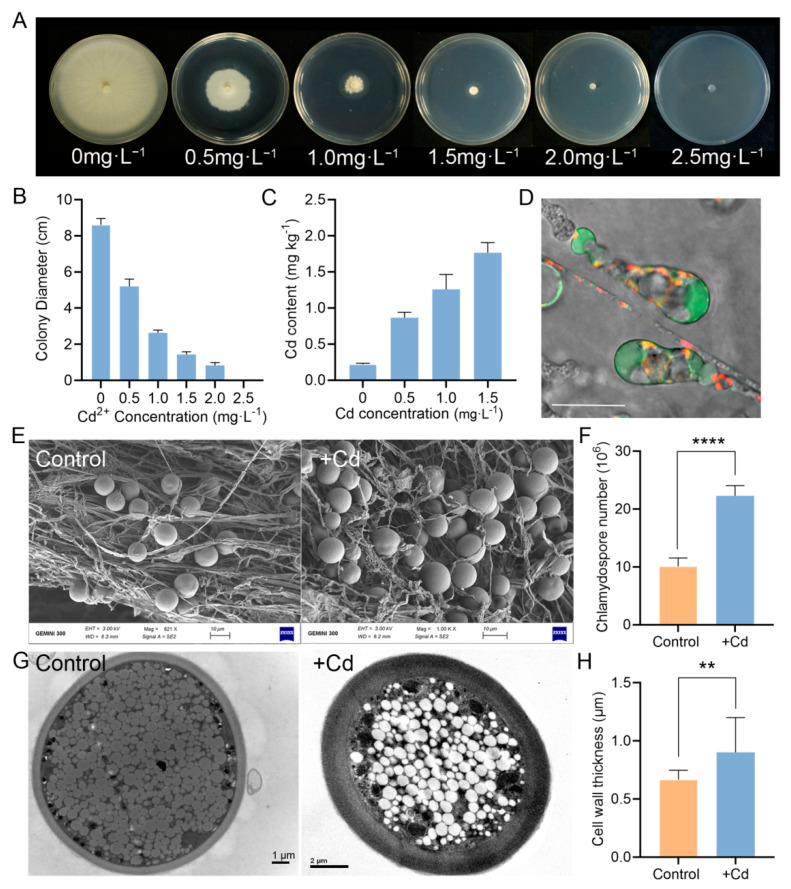
Cd tolerance assay of P. indica. (A) Colony morphology of P. indica exposed to different concentrations of Cd. (B) Fungal growth of P. indica cultured on different concentrations of Cd for 10 days. (C) The Cd accumulation in P. indica. (D) Cellular Cd2+ distribution in P. indica grown in PDA supplemented with 0.5 mg·L−1 Cd for 10 days. Scale bars = 10 μm. (E) Comparison of the fungal morphology of P. indica treated with 0 and 0.5 mg·L−1 of Cd by SEM microscopy. (F) Effect of Cd on chlamydospore production. P. indica was treated with 0 and 0.5 mg·L−1 of Cd, respectively. (G) Scanning electron microscopy of chlamydospores. (H) Effect of Cd on chlamydospore cell wall thickness. P. indica was treated with 0 and 0.5 mg·L−1 of Cd, respectively. The bars represent the means ± SDs. Significant differences (t-test): ** means p < 0.01. **** means p < 0.0001.

