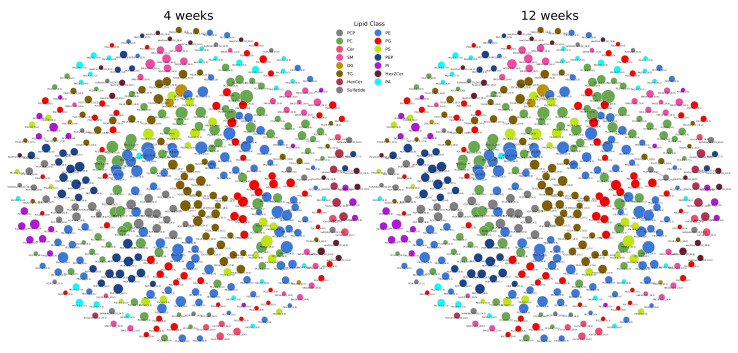
Figure A4.
Lipid networks of the lipidomics data from Tu et al. [19]. Nodes are colored by lipid class and edges show correlations between lipids for each mouse age group. Significant and negative correlations are blue, significant and positive correlations red, and insignificant correlations gray. Other time points show similarly less significant correlations (not shown here).

