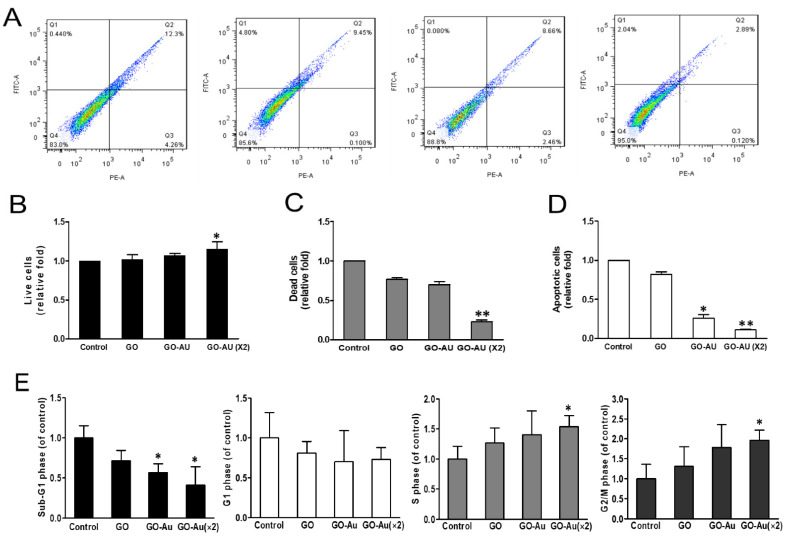
Figure 4.
The cell viability assay of MSCs on different materials. (A) Annexin V-PI double staining was used by flow cytometry. The results evaluated that the number of (B) live cells, (C) dead cells, (D) apoptotic cells. * p < 0.05 and ** p < 0.01. Cells were cultured on various nanomaterials of GO, GO-Au, and GO-Au (×2) for 24 h, and then cells were harvested and subjected to analyze cell cycle distribution using a flow cytometry analysis. (E) The cell cycle distribution was further analyzed and shown in bar graphs. The quantification in respective cell cycle phases of Sub-G1, G1, S, and G2/M. All values were expressed as means ± SD of three independent experiments. * p < 0.05.

