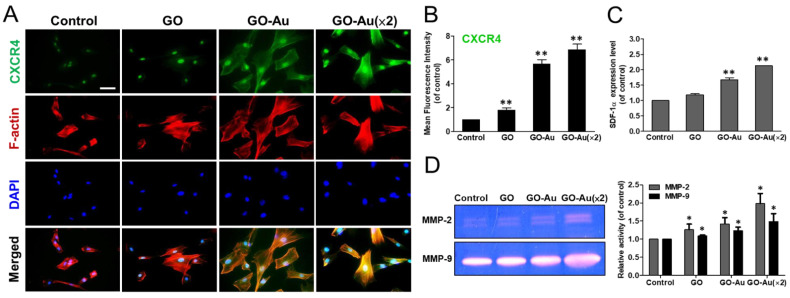
Figure 5.
Biological assessment of MSCs on different materials. After cells were cultured on various nanomaterials of GO, GO-Au, and GO-Au (×2) for 24 h and/or 48 h, (A) cells were, then, analyzed for cell migratory ability using an immunofluorescence assay through incubation with anti-CXCR4 antibody (green) and F-actin phalloidin dye (red). Scale bar = 20 μm. (B) The quantification data obtained from the fluorescence intensity of CXCR4 expression. (C) The expression level of SDF-1α and (D) the MMPs’ activity were obtained from supernatant of MSCs grown on various nanomaterials for 48 h using ELISA analysis and gelatin zymography analysis, respectively. The quantification of MMP-2/9 expression was also acquired using an Image Pro Plus 5.0 software. Data were presented as the mean ± SD, * p < 0.01 and ** p < 0.001.

