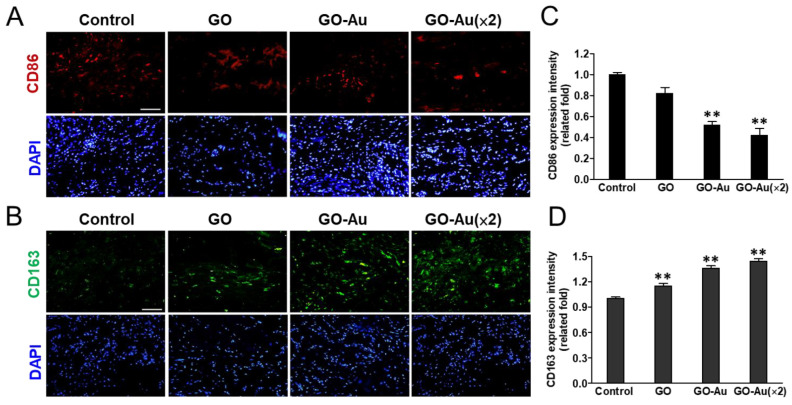
Figure 9.
Immunohistochemical analysis of macrophage phenotype markers. Sections of explanted nanocomposites of GO, GO-Au, and GO-Au (×2) with surrounding tissue were stained for macrophage phenotype markers of (A) CD86 (M1) (red) and (B) CD163 (M2) (green). Cell nuclei were stained with DAPI (blue). Scale bar = 20 μm. The fluorescence intensity of (C) CD86 and (D) CD163 were quantified and recorded. Data are shown as mean ± SD (n = 6). ** p < 0.01 as compared with the control group.

