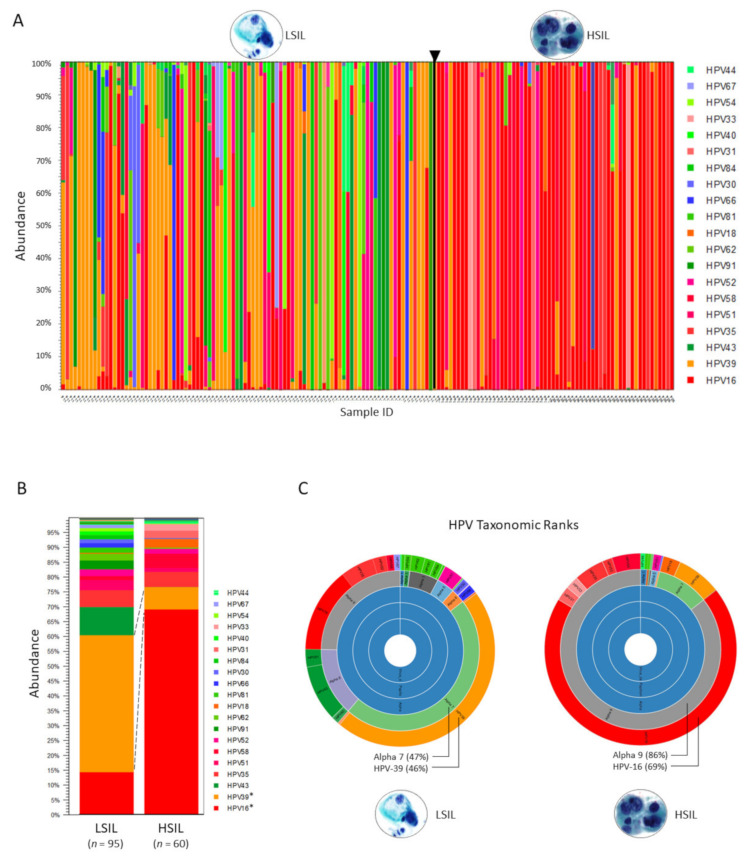
Figure 1.
Taxonomic profiling results based on the HPV Reference Index. (A) Abundance of HPV genotypes found in individual LSIL and HSIL samples are shown as stacked bars. HPV type-specific carcinogenicity (carcinogenic, possibly carcinogenic, and not carcinogenic) are colorized in shades of red, blue, and green, respectively (legend). Deep sequencing of HPV E6/E7 amplicons derived from each LSIL (n = 95) or HSIL (n = 60) sample identified 32 unique HPV genotypes with the top 20 shown (legend) and quantitated their composition (%) based on abundance (n) of mapped reads to total mapped reads. (B) HPV genotype composition of samples grouped by cytological grade i.e., LSIL and HSIL. Visualization and comparison of grouped samples (stacked bars) revealed the dominant genotypes in LSIL and HSIL as HPV-39 (46%) and HPV-16 (69%), respectively with significant changes in proportional composition (Baggerley’s test, * p-value (Bonferroni) < 0.001). (C) Sunburst plots visualize hierarchical data outwardly from parent to child nodes. Here, sunburst plots reveal distinct differences in the HPV communities according to seven taxonomic ranks, specifically, the last two ranks (genus/species and genotypes) between LSIL and HSIL.

