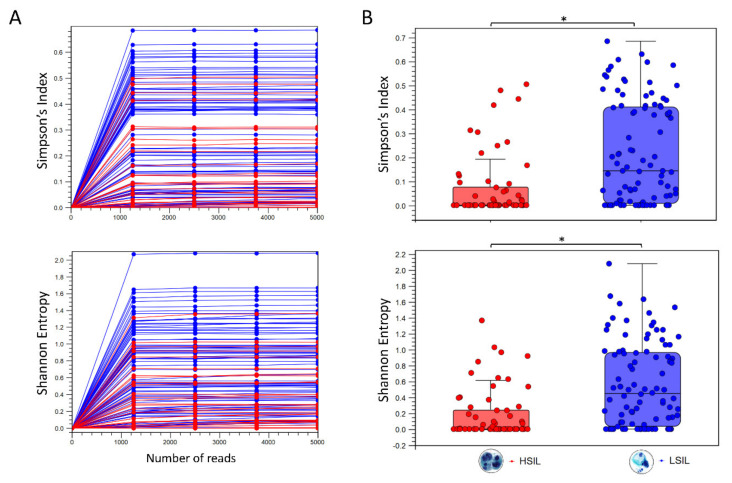
Figure 2.
Diversity analysis of HPV genotypes in LSIL and HSIL samples. (A) Alpha diversity rarefaction curves estimate the indices for HPV genotypes in LSIL (n = 95) and HSIL (n = 60) samples. (B) Summary statistics are shown as boxplots after categorical grouping. A total of 29 unique genotypes were found in LSIL versus 22 genotypes for HSIL. Species richness measured by Simpson’s index showed a reduction from LSIL (median = 0.146) to HSIL (median = 0.062) samples (Mann-Whitney test, * p < 0.001). The respective Shannon indices for LSIL (median = 0.454) and HSIL (median = 0.215) were indicative of reduced diversity with disease progression (Mann-Whitney test, * p < 0.001).

