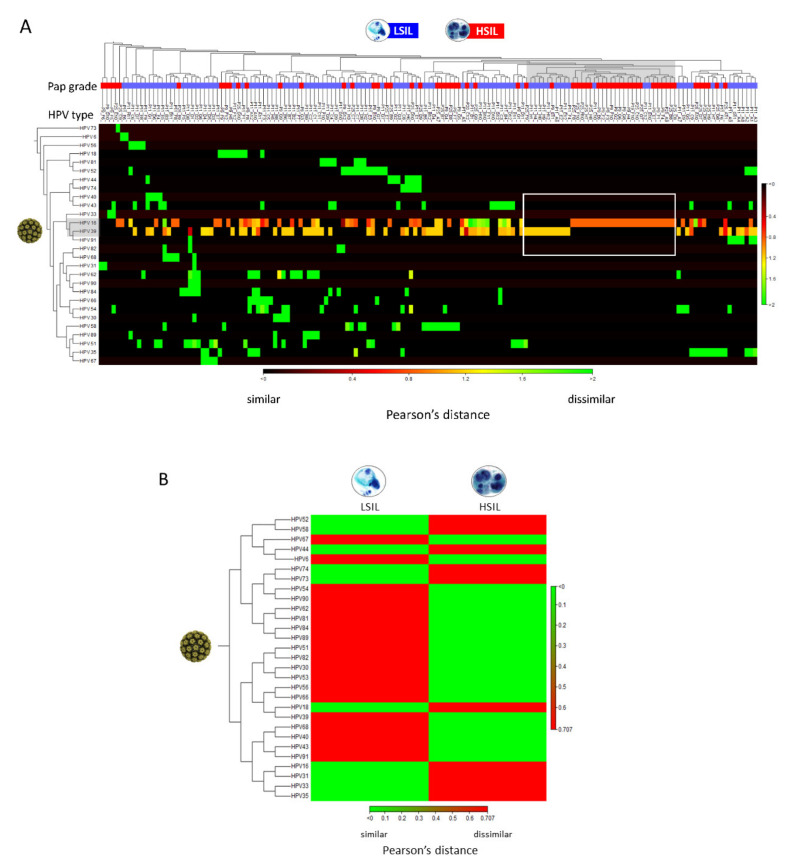
Figure 4.
Clustered heat map of HPV abundance among LSIL/HSIL samples. (A) The heat map represents two-way hierarchal clustering of HPV over LSIL/HSIL samples (n = 155) and clustering of LSIL/HSIL samples over HPV. The dissimilarity measure i.e., Pearson’s distance (1- | Pearson correlation|) quantifies the dissimilarity in the variables of interest i.e., HPV type-specific abundance between individual samples. The agglomerative clustering method identifies the originating, most similar pair of clusters (gray shade). In this dataset, single (pure) infections of HPV-16 in HSIL and HPV-39 in LSIL of high abundance (rectangle) are the closest clusters. From this point, cluster divergence toward the left part of the heat map reveals increasingly, heterogeneous HPV infections predominantly in LSIL samples. The color scale shows Pearson’s distance between 0 (black) and 2 (green) indicating similar and dissimilar correlation coefficients, respectively. (B) Aggregated heat map of LSIL (n = 95) and HSIL (n = 60) samples reveal dissimilar, groupwise HPV profiles useful for data simplification and taxonomy development. The prevailing (abundant) genotypes for LSIL or HSIL are shown in red.

