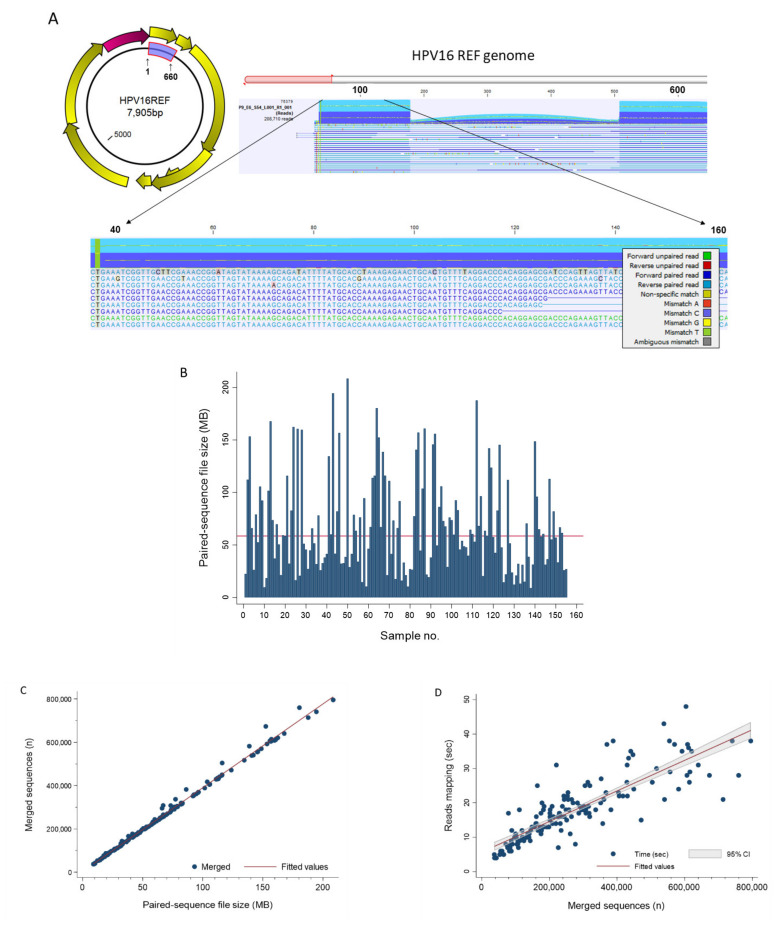
Figure 5.
Read Mapping. (A) The HPV E6/E7 (660 bp) gene segment highlighted in blue on the circular prototypical HPV-16 genome (GenBank ID: K02718) is the target used for amplicon sequencing and genotyping. The Map Reads to Reference workflow output displays the reads mapped on to the linearized HPV reference genome. Zooming in from the whole genome window (top) allows viewing of the sequences down to the nucleotide level (bottom). The color-coding legend defines the corresponding read types and nucleotide mismatches. (B) NGS paired-sequence file size for each of the 155 study samples. The bar chart reveals the extent of file size variation between samples. The median (▬) was 58.5 MB (range, 8.9–208.5). (C) Scatterplot between NGS paired-sequence file size (MB) and merged sequences (n) for the 155 study samples showed near-perfect linear correlation (R2 = 0.9945). The regression line (merged sequences = 3415 + 3868 × file size) is shown as (▬). (D) Merged sequences (n) and reads mapping time (s) for the study cohort (n = 155) were highly correlated (R2 = 0.7233) as shown by the scatterplot and regression line (mapping time = 5.7 + 4.44 × 10⁻⁵ × merged sequences) (▬). The equations above may be used jointly or independently to estimate total mapping time based on file size or number of sequences.

