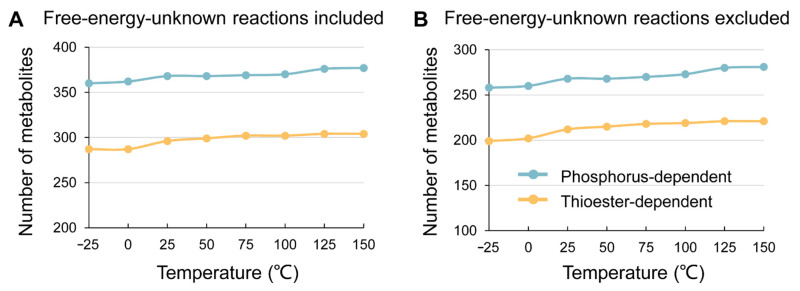
Figure 1.
The scale of thermodynamically constrained networks at different temperatures. The figure shows the number of metabolites of the networks at different temperatures. (A) Including the reactions without accurate free energy estimation; (B) excluding the reactions without accurate free energy estimation. The green lines represent the phosphate-dependent networks, while the yellow lines represent the thioester-dependent networks. With the increase in temperature, the scales of the networks increase slightly.

