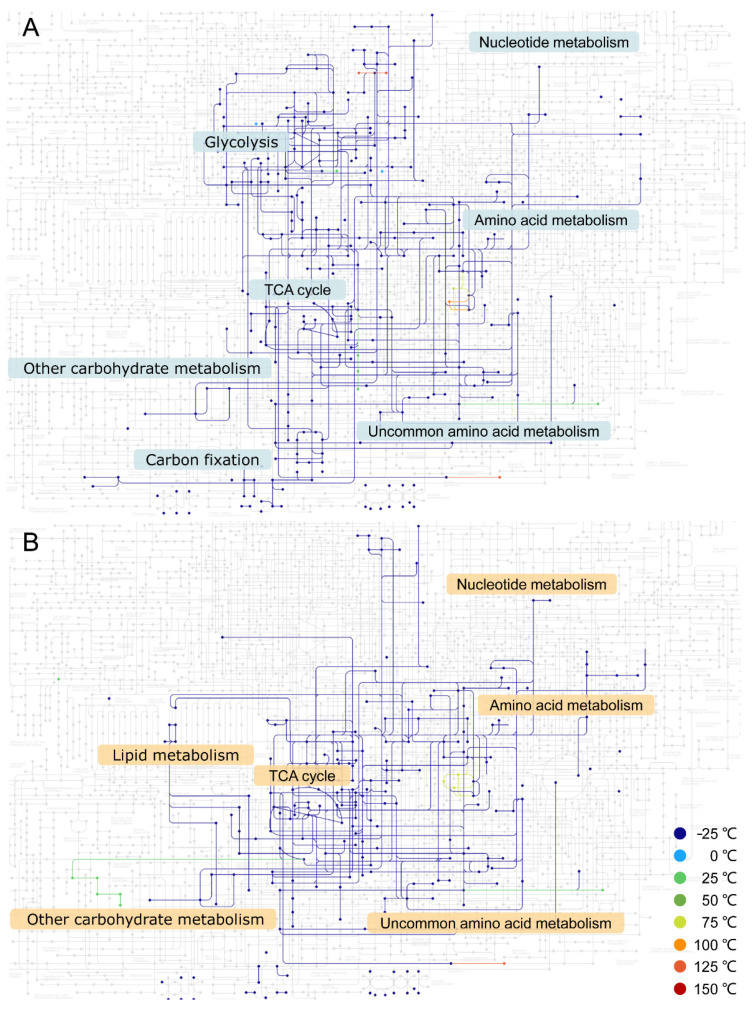
Figure 2.
Metabolic networks at different temperatures. (A) Phosphate-dependent network; (B) thioester-dependent network. Reactions without accurate free energy estimation are included. The metabolites and reactions that appeared at different temperatures are represented by dots and lines of different colors, respectively. Light gray represents KEGG reference metabolites and reactions unavailable during the network expansions. Most reactions and metabolites can be achieved at −25 °C. One metabolite can be displayed as multiple nodes in the figure. The reactions and metabolites in different networks can be found in Table S3.

