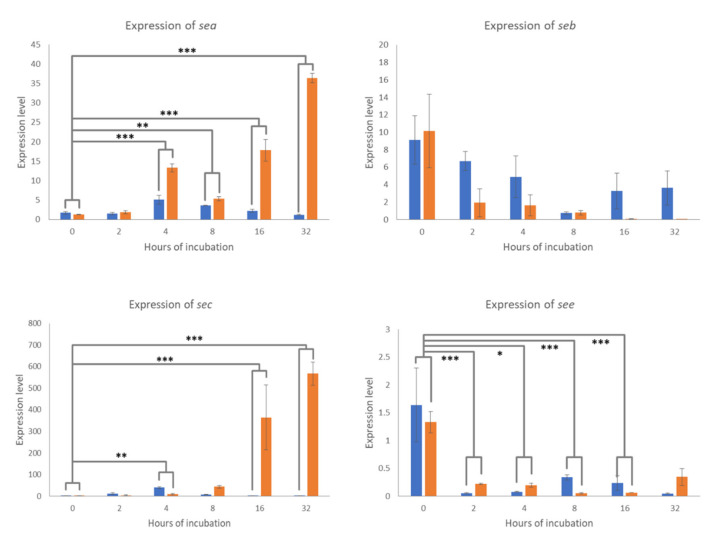
Figure 1.
Relative expression levels of sea, seb, sec, and see genes of staphylococcus in milk. Asterisks indicate statistically significant comparisons of the differences of the relative expression levels between 8 °C (blue bar) and room temperature (orange bar) at 0 h of incubation, and the differences of the relative expression levels between 8 °C and room temperature at 2, 4, 8, 16, and 32 h of incubation. Significant codes: * indicates p < 0.05, ** indicates p < 0.01, *** indicates p < 0.001.

