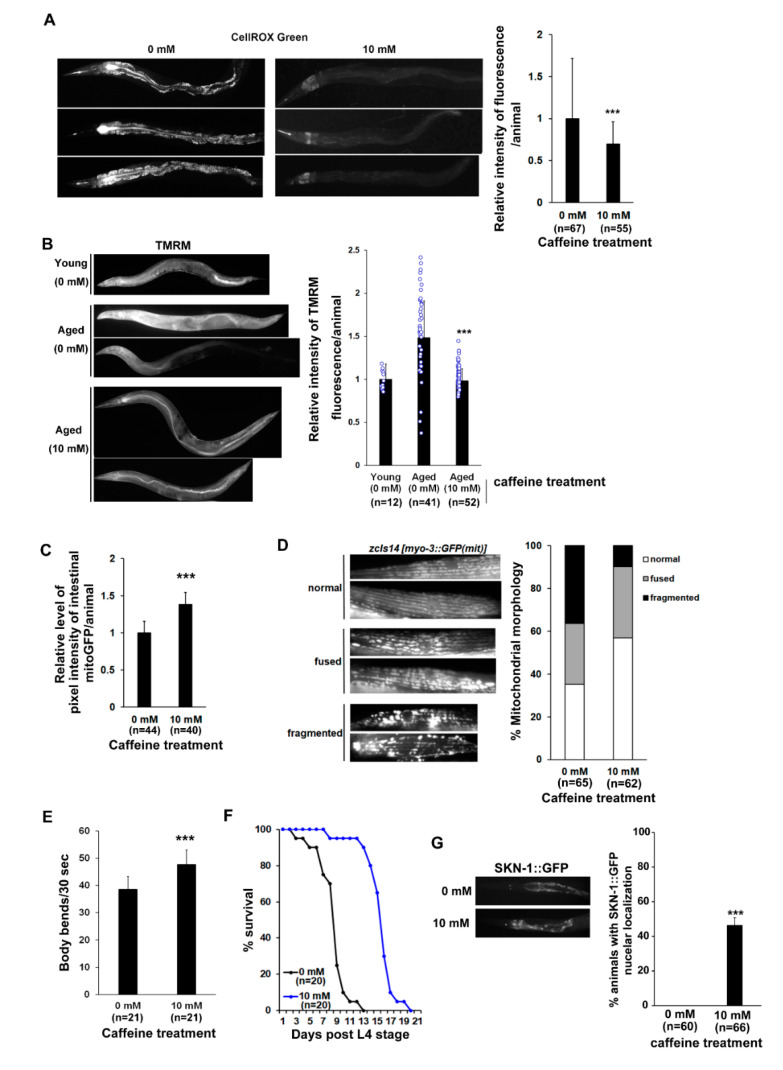
Figure 3.
Long-term caffeine intake improves mitochondrial function and motility during advanced ages of C. elegans: (A) Comparison of the mitochondrial reactive oxygen species (ROS) levels between the caffeine-free and caffeine-ingested animals by CellROX Green staining. Wild-type animals were treated with 0 or 10 mM caffeine at the L4 stage at 25 °C for 72 h. The graph shows the relative levels of mitochondrial ROS analyzed by ImageJ. Error bars represent SD. *** p < 0.001 (t-test); (B) Comparison of the mitochondrial membrane potential (MMP) in young (0 mM) and aged (0 mM; 10 mM) animals using tetramethylrhodamine methyl ester (TMRM) staining. In the aged groups, wild-type animals were treated with 0 or 10 mM caffeine at the L4 stage at 25 °C for 72 h. In the young (0 mM) group, wild-type animals were treated with 0 mM caffeine at the L4 stage at 25 °C for 24 h. The TMRM fluorescence was quantified for each test condition by ImageJ. The graph shows the relative levels of MMP. Error bars represent SD. *** p < 0.001 (one-way ANOVA with Tukey’s post hoc test); (C) Comparison of intestinal mitochondrial activity in ges-1p::GFP(mit) transgenic animal expressing ges-1 promoter driven GFP. The transgenic animals were treated with 0 or 10 mM caffeine at the L4 stage at 25 °C for 72 h. The graph shows the relative levels of fluorescence intensity as analyzed by ImageJ. Error bars represent SD. *** p < 0.001 (t-test); (D) The mitochondrial morphology was analyzed using the SJ4103 transgenic animal expressing a mitochondrial-targeted GFP under the control of the muscle-specific myo-3 promoter. The transgenic animals were treated with 0 or 10 mM caffeine at the L4 stage at 25 °C for 72 h. The graph indicates the percentage of animals with muscle mitochondria classified into three categories: (1) normal, (2) fused, and (3) fragmented; (E) Comparison of body bending in caffeine-free diet animals and caffeine-ingested animals at advanced ages. Wild-type animals were treated with 0 or 10 mM caffeine at the L4 stage at 25 °C for 72 h. Error bars represent SD. *** p < 0.001 (t-test); (F) Comparison of the survival rates between the caffeine-free diet animals and caffeine-ingested animals. Wild-type animals were treated with 0 or 10 mM caffeine at the L4 stage until dead at 25 °C; (G) Animals expressing skinhead 1 (SKN-1)::GFP were treated with 0 or 10 mM caffeine at the L4 stage at 25 °C for 72 h. The expression levels of SKN-1::GFP were observed at 72 h post-L4-stage animals at 25 °C. Error bars represent SD. *** p < 0.001 (t-test).

