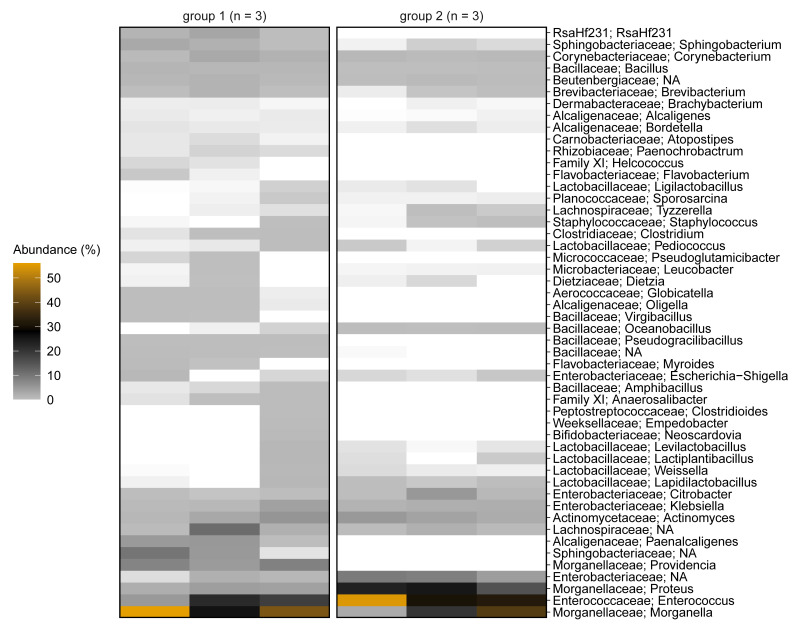
Figure 2.
Heat map showing the bacterial communities in the BSFL guts representing group 1 (G1) and group 2 (G2) larvae, based on 16S rRNA gene amplicon sequencing. The relative abundances of ASV counts are collapsed to the genus level for all replicates. Family assignments are prefixed. Percentage relative abundance is color-coded from light gray, through black, to orange, the last representing the highest abundance. Families depicted in white were not detected in the sample. Only the top 50 genera are shown, measured by the mean counts per genus level over all samples. Genera Clostridium sensu stricto 1, 15 and 18 are collapsed to the genus Clostridium. Genera with undefined family and genus are not shown.

