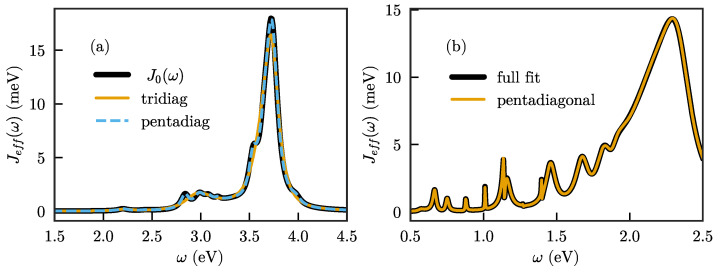
Figure 7.
(a) Fit of the spectral density of Figure 2a when allowing next-nearest neighbor interactions in the chain, compared to a fit with only nearest neighbor interactions with the same number of modes (); (b) fit of the spectral density of Ref. [38] using a chain with next-nearest neighbor interactions. Black line: Original fit using a full matrix , with all modes coupled to the emitter. Yellow line: Fit of the same data using a chain with only next-nearest neighbor interactions, and the emitter only coupled to the first two sites.

