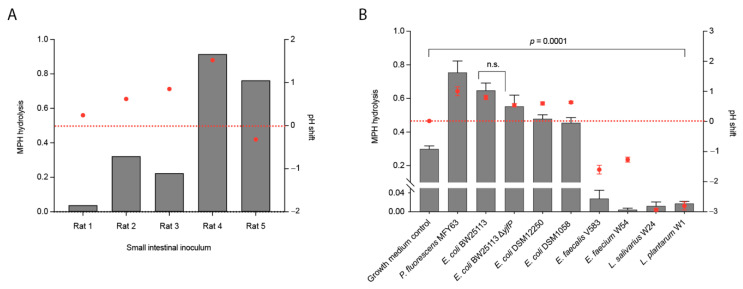
Figure 2.
Methylphenidate hydrolysis in complex and pure bacterial cultures. (A) Methylphenidate hydrolysis by small intestinal luminal microbiota from WTG rats (n = 5) (grey bars; left y-axis) and pH changes during incubation with 50 µM methylphenidate at pH 7.0 (red dots; right y-axis). (B) Methylphenidate hydrolysis by gut bacterial pure cultures (grey bars; left y-axis) and pH changes during incubation with 50 µM methylphenidate at pH 7.0 (red dots; right y-axis). Hydrolysis is shown as the ratio of [RA]24h/[MPH]0h quantified in ng/µL and normalized to d10-ritalinic acid. pH changes during bacterial growth are shown as pH shift after 24 h. Error bars represent standard deviation (S.D.) (n = 3).

