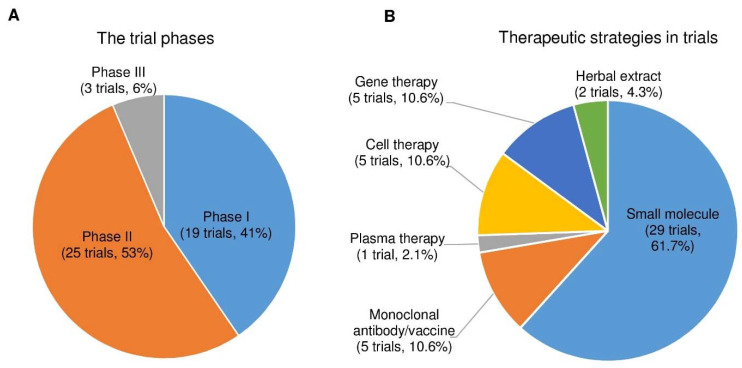
Figure 4.
The trial phases and therapeutic strategies in the clinical trials for PD treatment. (A) A pie chart shows the individual percentage of phase I, phase II, and phase III trials to the total. The phase I/II or II/III trials on ClinicalTrials.gov are showed as phase I or II, respectively. (B) A pie chart shows the proportions of each therapeutic strategy to the total PD clinical trials.

