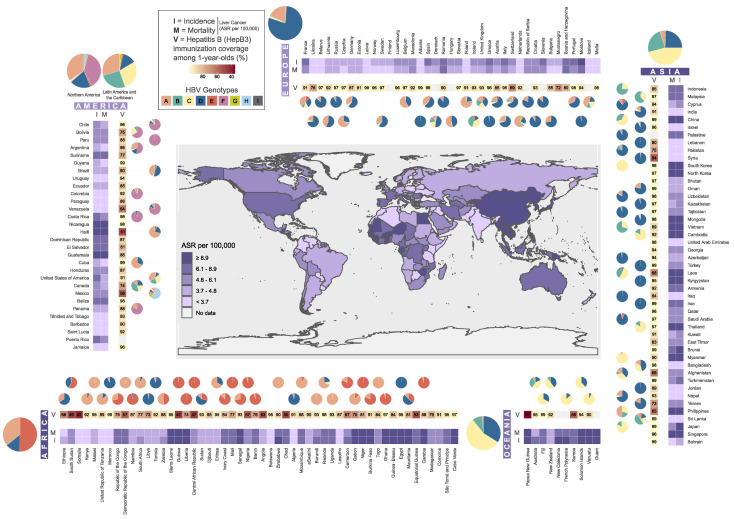
Figure 1.
Geographical distribution of liver cancer incidence and mortality rates (Age-Standarized Rate-ASR per 100,000—data derived from WHO-Global Cancer Observatory: Available online: gco.iarc.fr (accessed on 8 May 2012)), percentage of Hepatitis B (HepB3) immunization coverage among one-years-olds (data derived from WHO–Global Health Observatory data repository: apps.who.int/gho/data/view.main.80300 accessed on 18 August 2021) and HBV genotypes (data derived from Velkov et al. [36]). The world map has been colored with respect to the Liver Cancer Incidence Rate (ASR per 100,000). The ASR Incidence and Mortality as well as the percentage of the HepB3 immunization coverage among one-years-olds are depicted as a heatmap, while the pie charts represent the proportional (%) HBV genotype distributions in the respective countries. All plots were generated using the ggplot2 R package [37].

