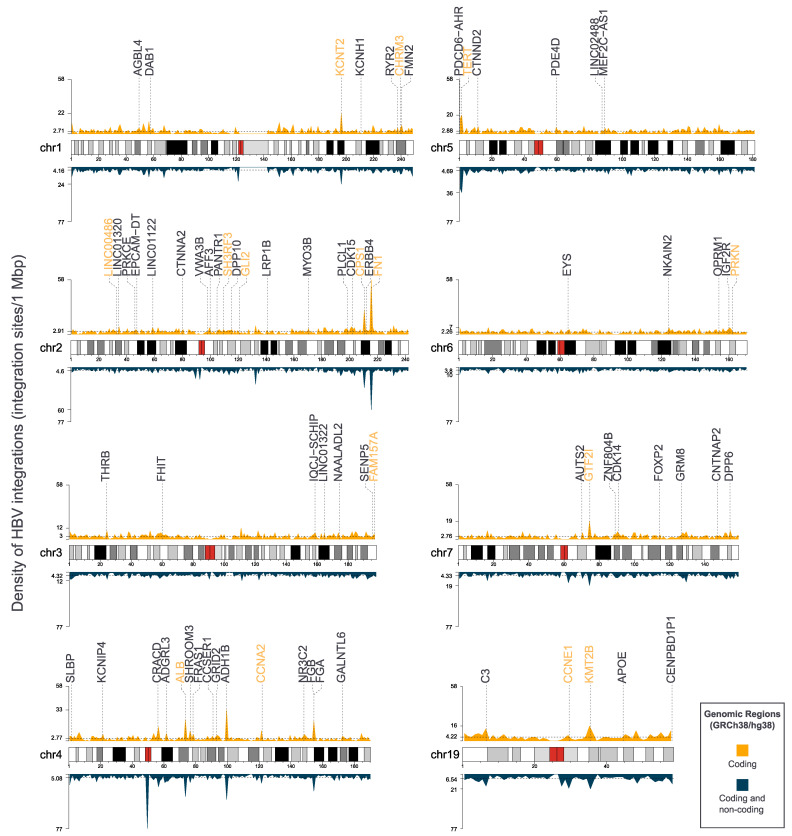
Figure 4.
HBV DNA integration density plots for the chromosomes 1–7 and 19 in which the recurrently affected genes are localized. The yellow density plots represent the density of integrations per 1 Mbp (1,000,000 bp) through the chromosome that are referring to coding genomic regions, while the blue density plots represent the density of integrations per 1 Mbp that are referring to all genomic regions (coding and non-coding). The mean values are depicted via the horizontal dashed lines, and the locations of the main target genes are also present. The plots were generated with the karyoploteR R package [187].

