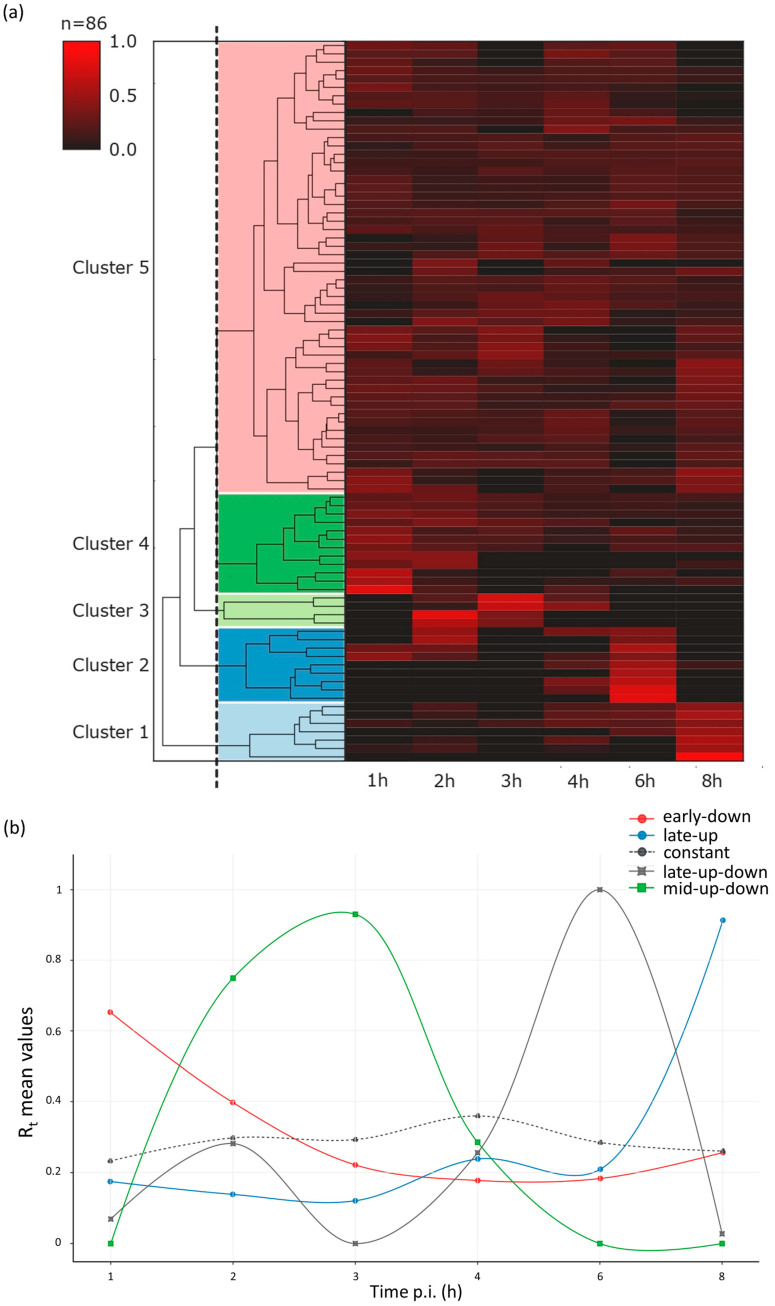
Figure 3.
Expression profiles of the most abundant dynamic VACV transcripts and transcript isoforms. Rt values of the viral transcripts show distinct expression profiles in the five kinetic clusters. (a) The expression pattern of the viral transcript clusters. Five distinct VACV transcript clusters represented by a heatmap matrix. Each row represents changes in relative expression levels of an RNA. Red rectangles indicate high relative expression values and black rectangles indicate low relative expression values. (b) K-means clustering analysis was used to characterize the temporal expression of the five clusters obtained by hierarchical clustering. Relative Rt mean values of clusters are delineated in different time points of infection. All transcripts were identified using the LoRTIA pipeline. We note here that full-length sequencing provides a unique technology that is able to detect individual transcripts. Techniques lacking this ability (qPCR, short-read sequencing) cannot be used for the validation of the obtained results due to the high complexity of transcriptional overlaps in vaccinia virus.

