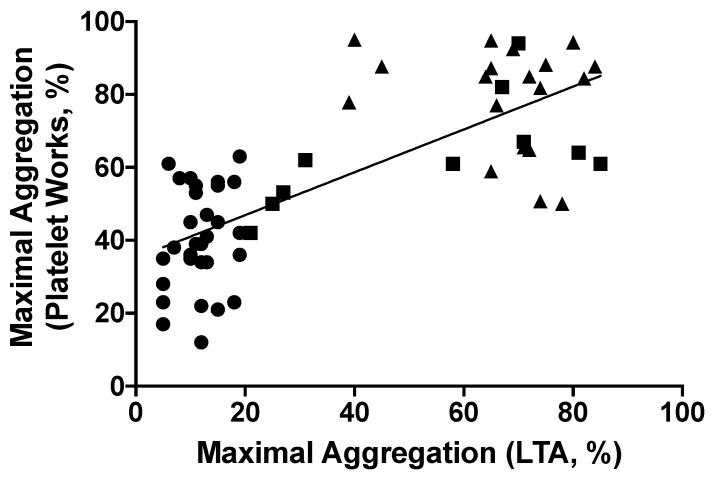
Figure 4.
Pearson correlation between maximal platelet aggregation in response to Arachidonic acid using Plateletworks® and light transmission aggregometry (n = 60). There is a good correlation between the two methods of platelet aggregation testing (r = 0.749, 95% CI: 0.6096 to 0.8432, p < 0.0001). Triangles represent patients not taking ASA (n = 20), circles represent ASA-sensitive patients (n = 30), and squares represent ASA non-sensitive patients (n = 10).

