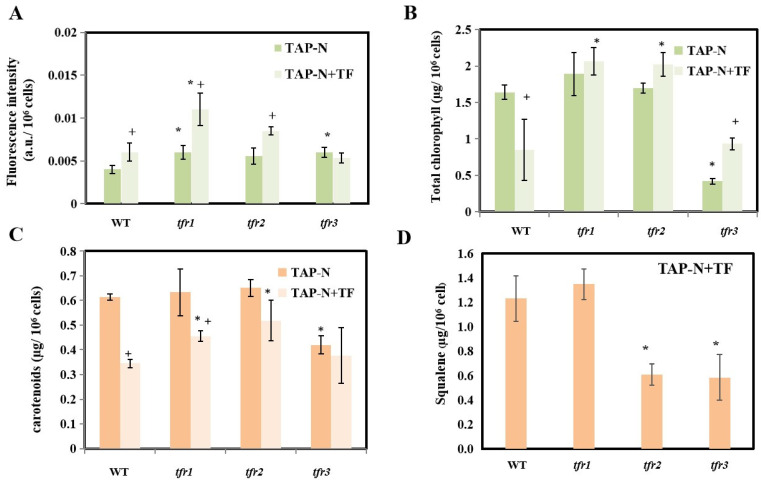
Figure 6.
Quantification of triacylglycerol (A), chlorophyll (B), carotenoid (C) and squalene (D) from cultures under N-deprived condition with and without terbinafine. All data are means ± SD of three biological replicates. Significant differences between the wild type (WT) and the mutants within the same condition are indicated by asterisks (*) (p < 0.05). Significant differences between different treatments of the same strain are indicated by plus sign (+) (p < 0.05).

