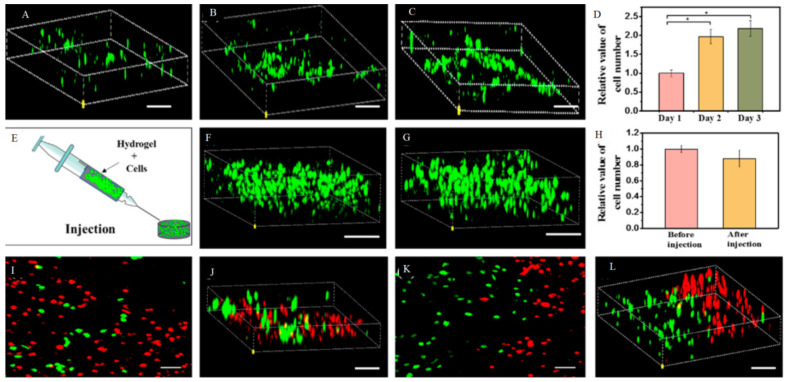
Figure 8.
Confocal image of cell proliferation of the C2C12 myoblasts encapsulated in the CS-AT10 hydrogels. (A) Visualization of cells proliferation during 1 (B) 2 and 3 days (C). Proliferation curve of the C2C12 myoblasts encapsulated in the hydrogel (D). Injection self-healing hydrogels with encapsulation cells (E) and visualization cells before (F) and after injection (G). The diagram indicated conductive hydrogel has the highest live cell numbers in the hydrogel after injection (H). Visualization two type of cells encapsulated injection hydrogel (I–L). Reused permission with from [79] Copyright © 2021 American Chemical Society.

