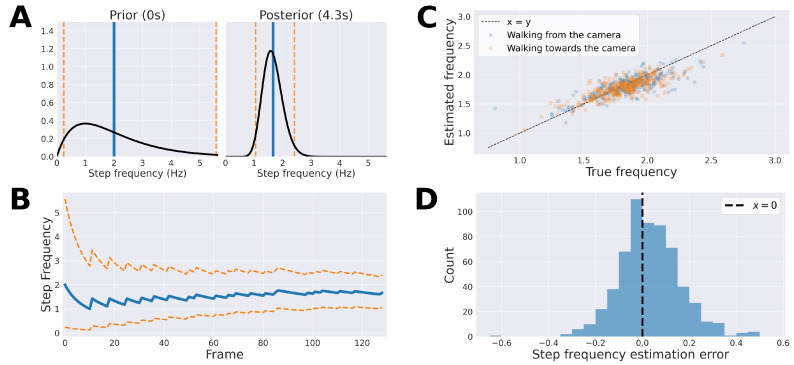
Figure 4.
Bayesian step frequency estimation. (A) Examples of the prior distribution (left) and a posterior distribution after 129 updates (i.e., after 129 frames or approximately 4.3 s of video); (B) the evolution of the posterior mean and 95% credible interval for the first 129 updates; (C) point estimates of the Bayesian step frequency model’s posterior distributions at the last frame of each video were highly correlated with the true labels (Pearson’s , ). The mean squared error between estimated and true step frequency was ; (D) the distribution of errors of step frequency point estimates in the last frame of each video. The mean error was , indicating a tendency to under-predict. The null-hypothesis that the population is normally distributed was rejected (Shapiro Wilk’s , ).

