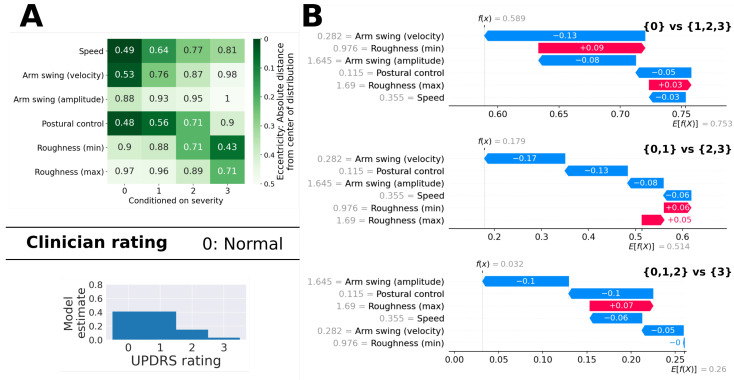
Figure 11.
Example with a slight disagreement between the clinician’s rating and the model’s estimate. (A) The eccentricity table at the top shows a less clear structure than the example in Figure 10. While speed, arm swing, and postural control are typical of low severity ratings, the roughness of the movement was fairly typical for higher severity ratings. The Clinician gave the patient a rating of 0, while the model estimated a score of 1, although the distribution at the bottom shows that the model’s probability estimate for rating 0 was very close to the probability for rating 1. (B) The three figures illustrate how the model arrived at its estimates. We computed SHAP values for the example based on each of the three different binary classifiers which are part of the ordinal model. It can be seen that, in all three classifiers, all feature values “push” towards lower ratings, except the two feature values that are related to the roughness of movement. The first classifier estimated the probability of the example receiving a rating of greater than 0 as 59%. The second classifier estimated the probability of the example receiving a rating of 2 or 3 as 18%. For both of the first two classifiers, the specific value for the “arm swing (velocity)” feature was most important.

