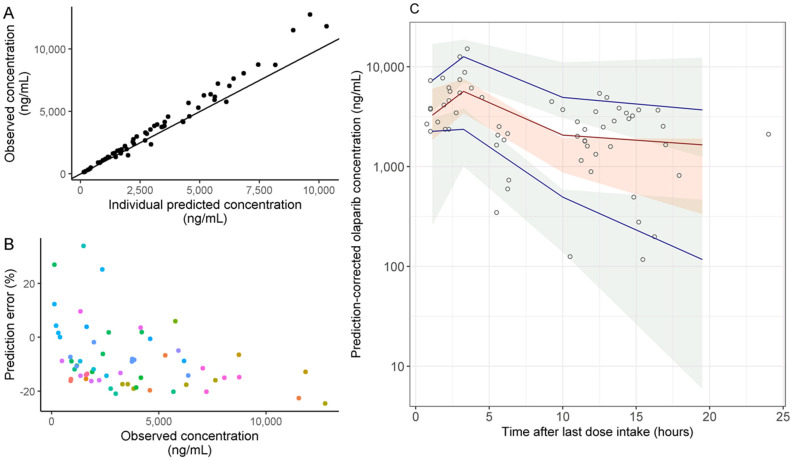
Figure 2.
Evaluation of the predictive performance of the population PK model. (A) Observed vs. individual predicted olaparib concentrations. Solid line represents the identity line (y = x) (B) Prediction error (PE) vs. observed concentrations. (C) Prediction-corrected visual predictive check (pcVPC) for olaparib. pcVPC obtained by N = 1000 simulations of the original dataset with the mean parameters (fixed and random effects). The shaded areas represent the 95% confidence intervals around the 5th, 50th (median) and 95th percentile of the simulated concentrations, the lines represent the 5th, 50th (median) and 95th percentile of the observed concentrations and the circles represent the observed concentrations.

