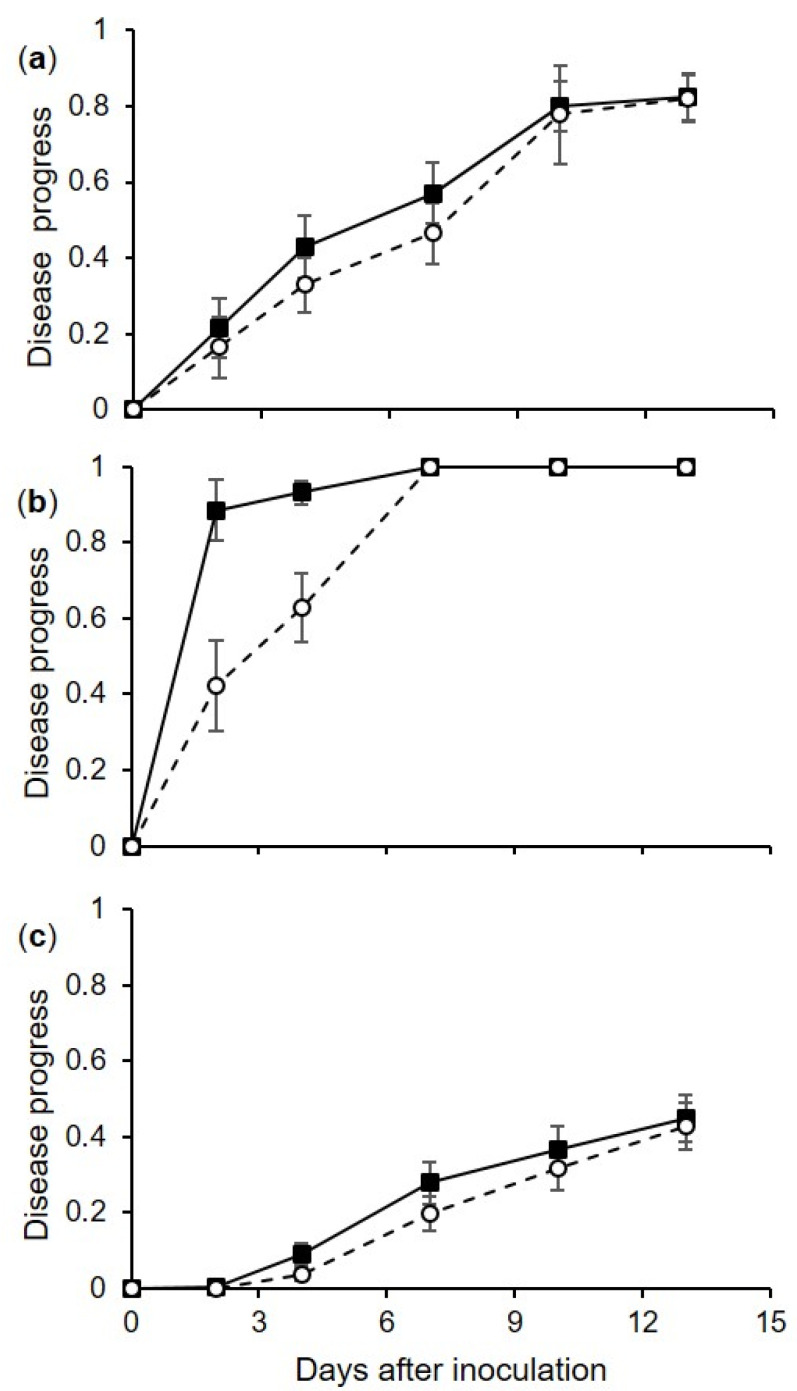
Figure 1.
Progress of disease incidence (as the proportion of berries showing symptoms, on a 0–1 scale, where 1 means all of the berries are affected; black squares) and severity (as the proportion of the berry surface showing symptoms, on a 0–1 scale, where 1 means all of the berry surface is affected; white circles) on grapevine berries inoculated with conidia of Coniella diplodiella (experiment 1). After uninjured berries (a), injured berries (b), or pedicels of uninjured berries (c) were inoculated, the berries were kept at 30 combinations of 6 temperatures (T: 10, 15, 20, 25, 30, and 35 °C) and 5 wetness duration periods (WD; 1, 3, 7, 12, and 24 h); each combination was represented by 3 replicates, with 15 berries per replicate. In each panel, values are means (±SE, n = 90) of disease incidence or severity with the 6 temperatures and 5 wetness duration periods.

