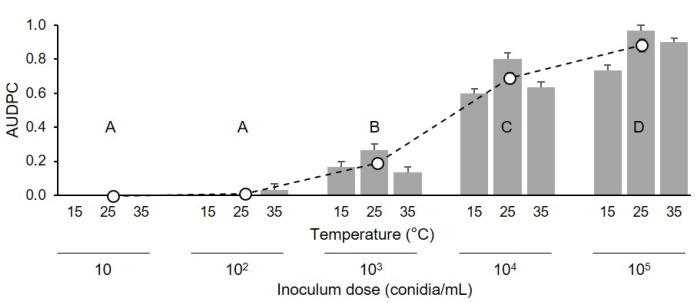
Figure 5.
Values of the area under the disease progress curve (AUDPC, dimensionless) for grapevine berries that were injured and then drop-inoculated with conidia of Coniella diplodiella at 5 inoculum doses (10, 102, 103, 104, or 105 conidia/mL), and then incubated at 3 temperatures (T: 15, 25, or 35 °C) for 24 h (experiment 2). AUDPC data were standardized by dividing the original AUDPC values by the time considered for their calculation, i.e., 9 d. Bars indicate means (± SE) of 3 replicates, with 15 berries per replicate. White dots are the means (± SE, n = 45) of the 3 incubation temperatures for each inoculum dose; letters show comparisons of the latter means as determined by Tukey’s HSD test, with p = 0.05.

