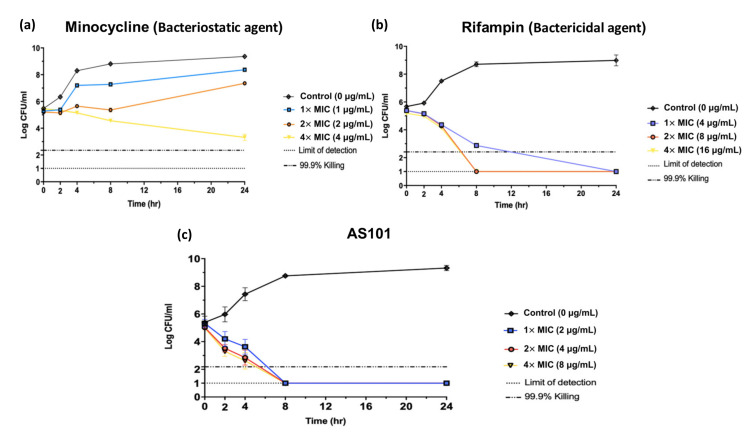
Figure 1.
Time kill curve for A. baumannii TSP-AB-03 with antibiotics. Bacteria were grown with the indicated concentrations of minocycline (a), rifampin (b) or AS101 (c). Cell densities were measured for three independent cultures by counting the number of colony-forming units of culture for 24 h. Dotted-dashed lines indicate 99.9% reduction in beginning inoculum. Dotted lines indicate detection limits. Error bars are the standard deviation from the mean.

