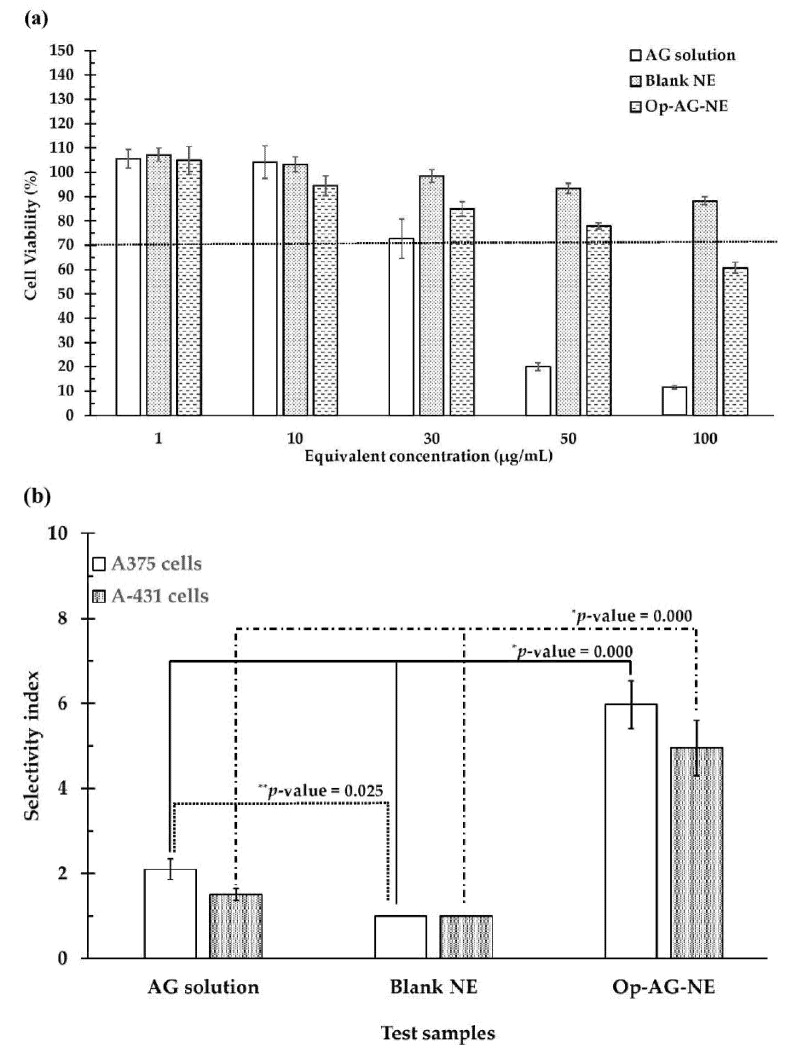
Figure 5.
(a): Cell viability (%) of the HFF-1 cells; (b) Selectivity index of AG solution, Blank NE and Op-AG-NE in the A375 and A-431 cells (mean ± SD, n = 3) (* and ** represent significant difference at p-values < 0.05 for the comparison of selectivity index of AG solution in the cells and that of Op-AG-NE, and for the comparison of selectivity index of AG solution in the cells and that of Blank NE, respectively).

