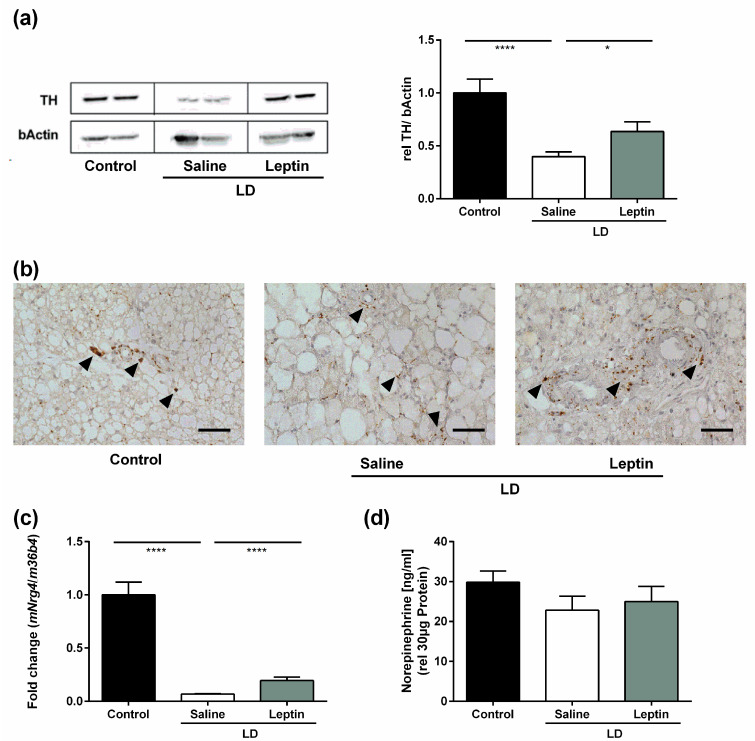
Figure 3.
Impact of chronic leptin treatment on BAT sympathetic markers in LD mice. (a) BAT TH protein expression determined by Western blot, (b) representative immunostaining of TH in BAT, (c) BAT mNrg4 mRNA expression determined by RT-qPCR, and (d) BAT norepinephrine levels determined by ELISA of control mice, saline-treated LD mice, and 3.0 mg/kg BW/d leptin-treated mice. Data are presented as mean ± SEM and represent N = 4 per group. Scale bar: 50 µm. Black arrowheads show TH immunoreactivity. Statistical significance was determined by one-way ANOVA with Bonferroni post hoc test. * indicates p < 0.05 and **** indicates p < 0.0001.

