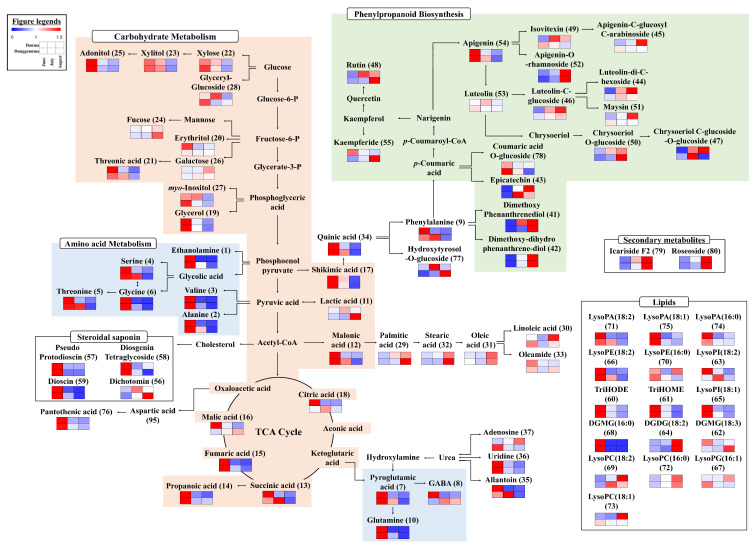
Figure 2.
Schematic diagram of primary and secondary metabolic pathways and relative metabolite contents in DAN and DUN leaves harvested in June, July, and August. The pathway was sourced from the KEGG database (http://www.genome.jp/kegg/ accessed on 1 August 2021) and modified. The colored squares (blue-to-red) represent fold changes normalized using the average peak area of each species according to the growth stage.

