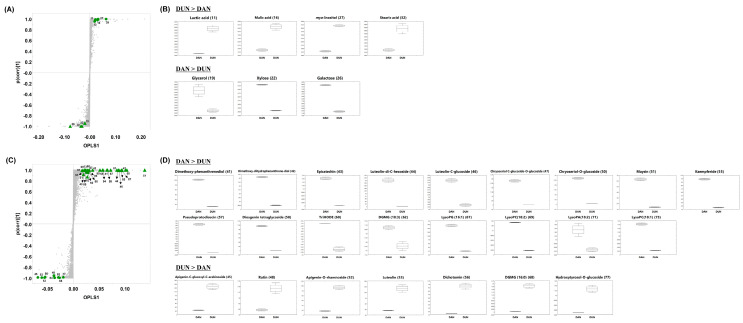
Figure 5.
(A,C) loading S-plots and (B,D) box and whisker plots showing relative metabolite abundances in DAN and DUN leaves collected in August constructed using (A,B) GC-TOF-MS and (C,D) UHPLC-Orbitrap-MS/MS data. Highlighted metabolites (▲: DAN, ●: DUN) in the S-plot indicate statistically significant differences between DAN and DUN leaves collected in August (VIP > 2.5 and p < 0.05 in OPLS-DA).

