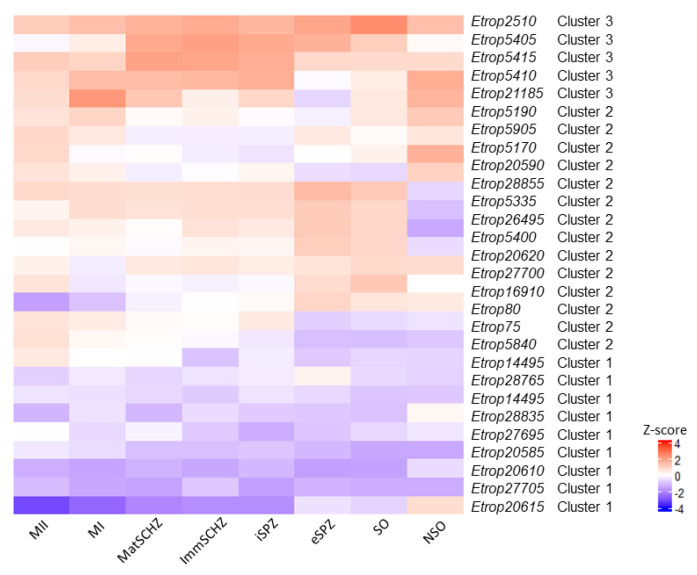
Figure 6.
Heatmap of differentially transcribed rhoptry kinase genes in the EtINRAE strain. Red color indicates a rhoptry kinase transcription level higher than the mean, and blue color represents a transcription level lower than the mean. NSO non-sporulated oocysts, SO sporulated oocysts, eSPZ extracellular sporozoites, iSPZ intracellular sporozoites, ImmSCHZ immature schizonts, MatSCHZ mature schizonts, MI first-generation merozoites, and MII second-generation merozoites. The cluster resulting from the hierarchical clustering analysis are indicated.

