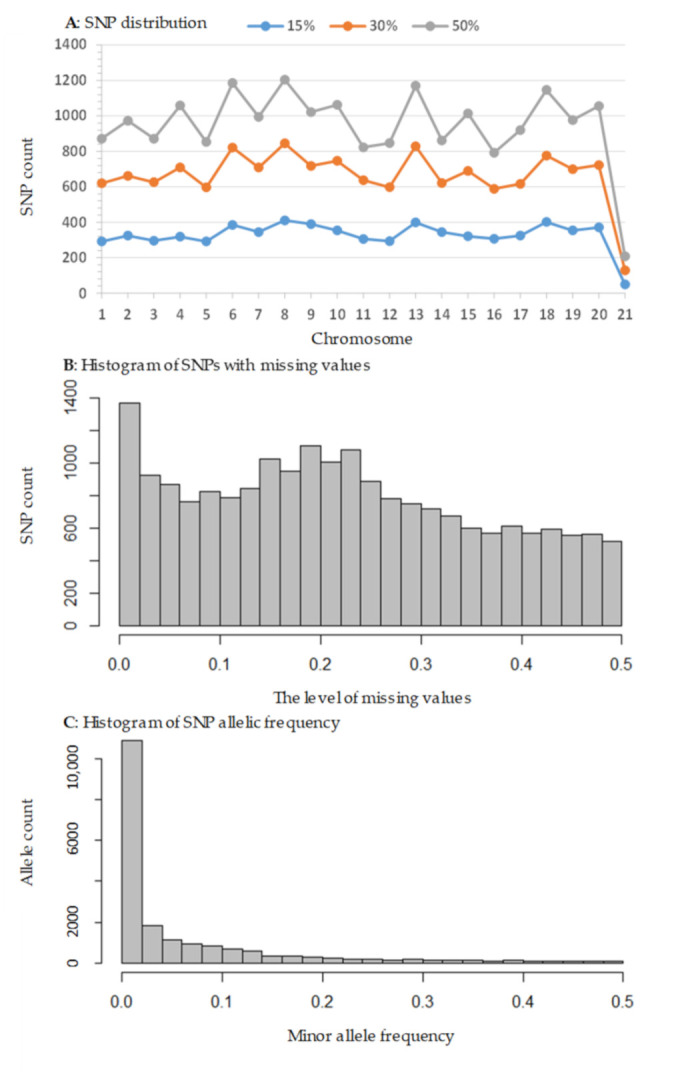
Figure 1.

The frequency distribution of SNPs identified in this study with respect to chromosome (A), the level of missing values (B) and minor allele frequency (C). Panel (A) shows the SNP counts over all 20 chromosomes for SNPs with three levels of missing values (15%, 30% and 50%) across the 571 samples. Note that chromosome 21 represents all 69 scaffolds. Panel (B) displays the SNP counts with respect to missing value levels ranging from 0 to 50%. Panel (C) shows the minor allele frequency distribution in the dataset of SNPs with a 50% missing value level.
