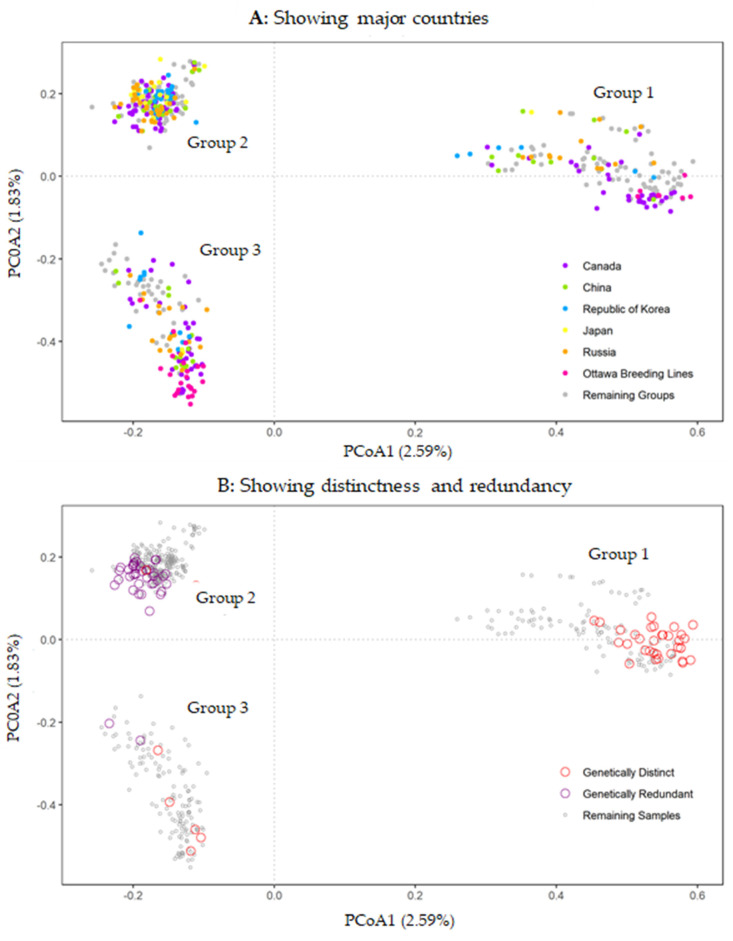
Figure 3.
PCoA plots of 571 soybean accessions based on 19,898 SNP genotype data with a missing value level of up to 50%. Panel (A) displays the accessions originated from Canada, China, the Republic of Korea, Japan, and Russia, as highlighted in different colours, while the remaining groups are shown in grey. Three groups are also labelled. Panel (B) shows 40 genetically distinct samples in open red circles and 40 genetically redundant samples in open purple circles, while the remaining samples are shown in open grey circles.

