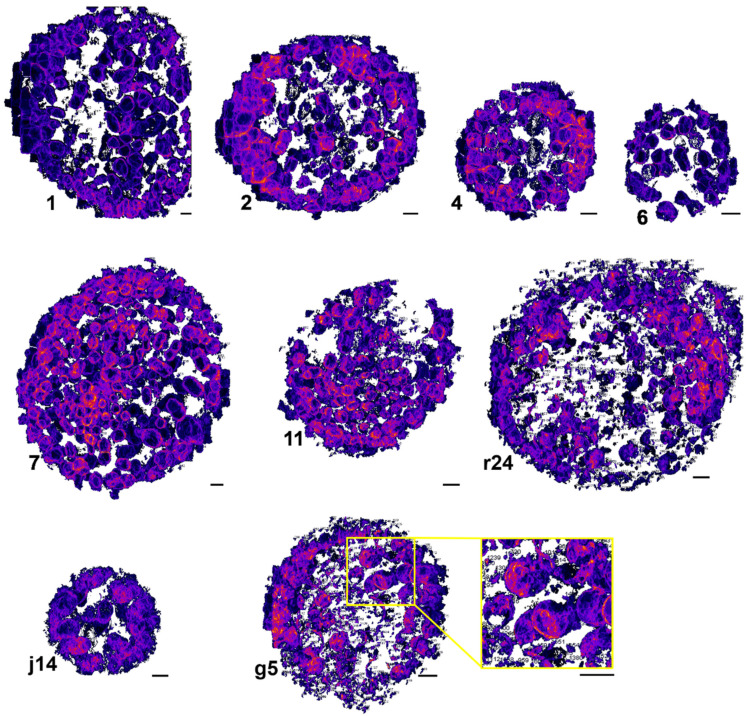
Figure 3.
3D rendering of C. trachomatis inclusion at 24 hpi after using our proposed segmentation pipeline. Inclusions were isolated from the cells using SuRVoS and then bacteria were individually segmented using an ImageJ script. Presented in this is figure non-manually curated data after maximum intensity projection to reveal the volume information. Numbers are generated by ImageJ to identify every volume. In the yellow box is a zoomed in part of g5. Scale bar: 1 µm.

