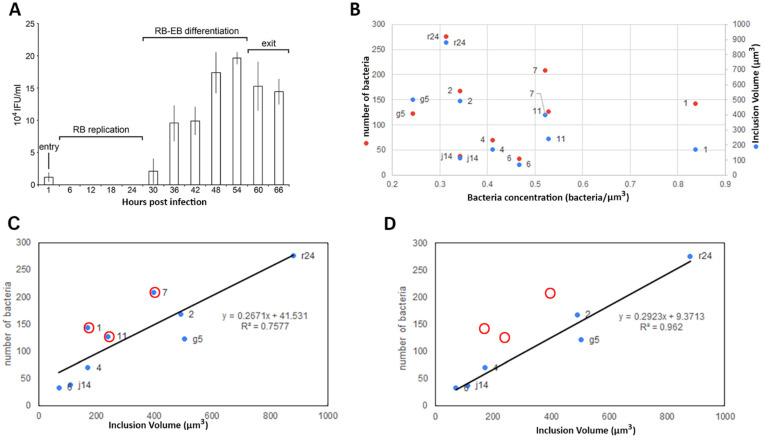
Figure 4.
C. trachomatis inclusions at 24 hpi are widely different in volume and number of bacteria. (A) C. trachomatis titration assay in HeLa cells at MOI 0.8. HeLa cells have been infected with C. trachomatis and the cells have been collected at the different time points shown. Then, the pelleted infected cells have been used to infect a fresh layer of cells to quantify the inclusion forming units (IFUs). The phase of infection is determined with regards to the IFU. RB: reticulate bodies, EB: elementary body. (B) After segmentation, each inclusion (ID as a data label in the graph as a number or number plus letter) volume, number of bacteria and consequent bacteria concentration have been plotted. (C,D) Number of bacteria as a function of the inclusion volume ((C), full dataset; (D), partial dataset; red circle highlights the absence of inclusion 1, 11 and 7).

