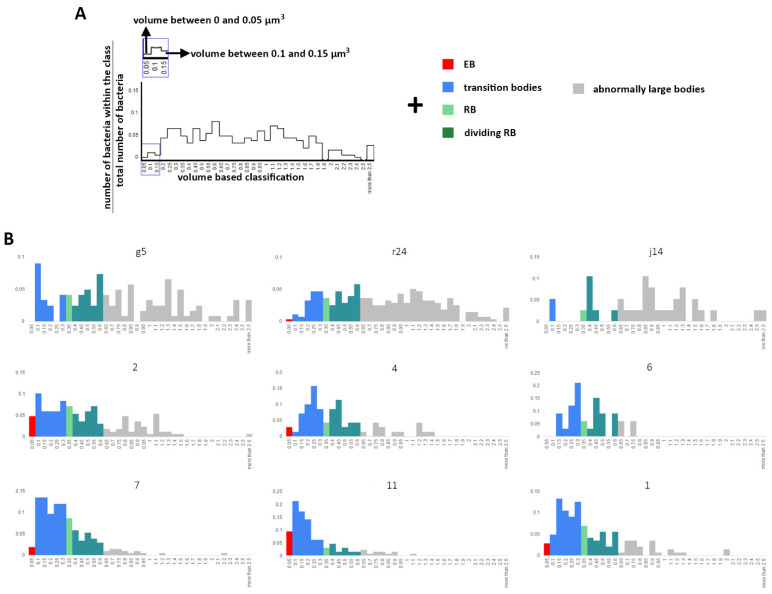
Figure 5.
Classification of bacteria population using the most accepted literature. After segmentation, the volume of individual bacteria has been determined and grouped in volume classes (x-axis) and the ratio of bacteria within the class (y-axis). Then, the volume classes are grouped into higher classes, depicted by a colour and representing a bacteria form based on the most accepted literature. An example is presented in (A), and the whole dataset is present in (B). The Axis in (B) are as for (A). EB: elementary bodies, RB: reticulate bodies.

