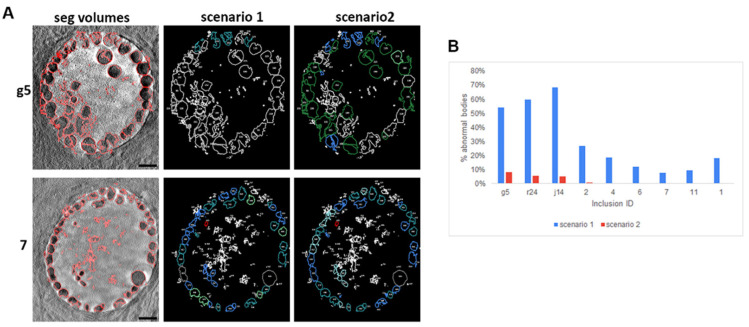
Figure 6.
Over-representation of abnormally large body in scenario 1 (Figure 5) when compared to scenario 2 (Figure 7). (A) Inclusions (7 and g5) were segmented with the same parameters following scenario 1 (presented in Figure 5) or 2 (presented in Figure 7), where volumes are associated with the most used in the literature or following Lee et al., respectively. Panels ‘seg volumes’ (segmented volumes); red highlights the boundary found by our segmentation pipeline. ‘Scenario 1′ and ‘scenario 2′ associate the delimited bacteria with its classification following higher classes and consequent colour coding as per Figure 5 and Figure 7, respectively. Scale bar: 5 µm. (B) Number of abnormal bodies per inclusion depending on the parameters used for classification (scenario 1 blue or 2 red).

